After I made a script for visualization of Portage Tree as wheel, small modifications now enabled it showing you the tree as the tree.
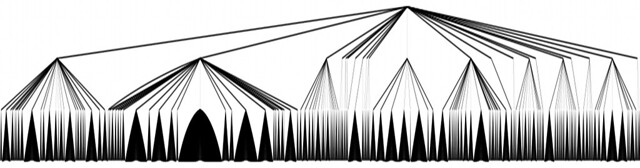
The following image is all packages in the tree:
And installed packages on my system:
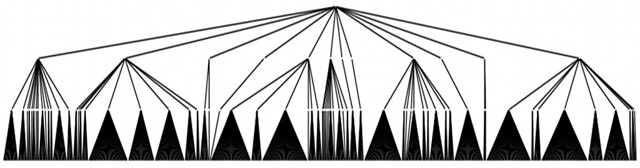
Both images are re-sized to 1024x269. You can view the Bash script.
The following image is all packages in the tree:
And installed packages on my system:
Both images are re-sized to 1024x269. You can view the Bash script.